
How a 3-Store Pizza Chain Cut Daily Reporting Time by 30-60 Minutes with n8n Automation
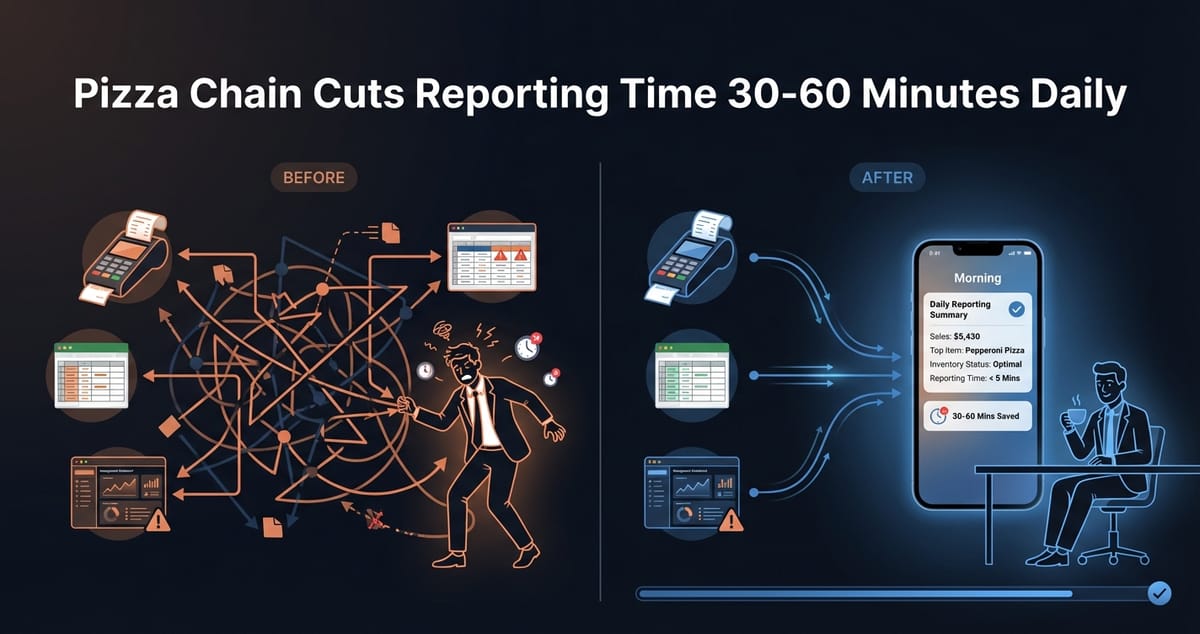
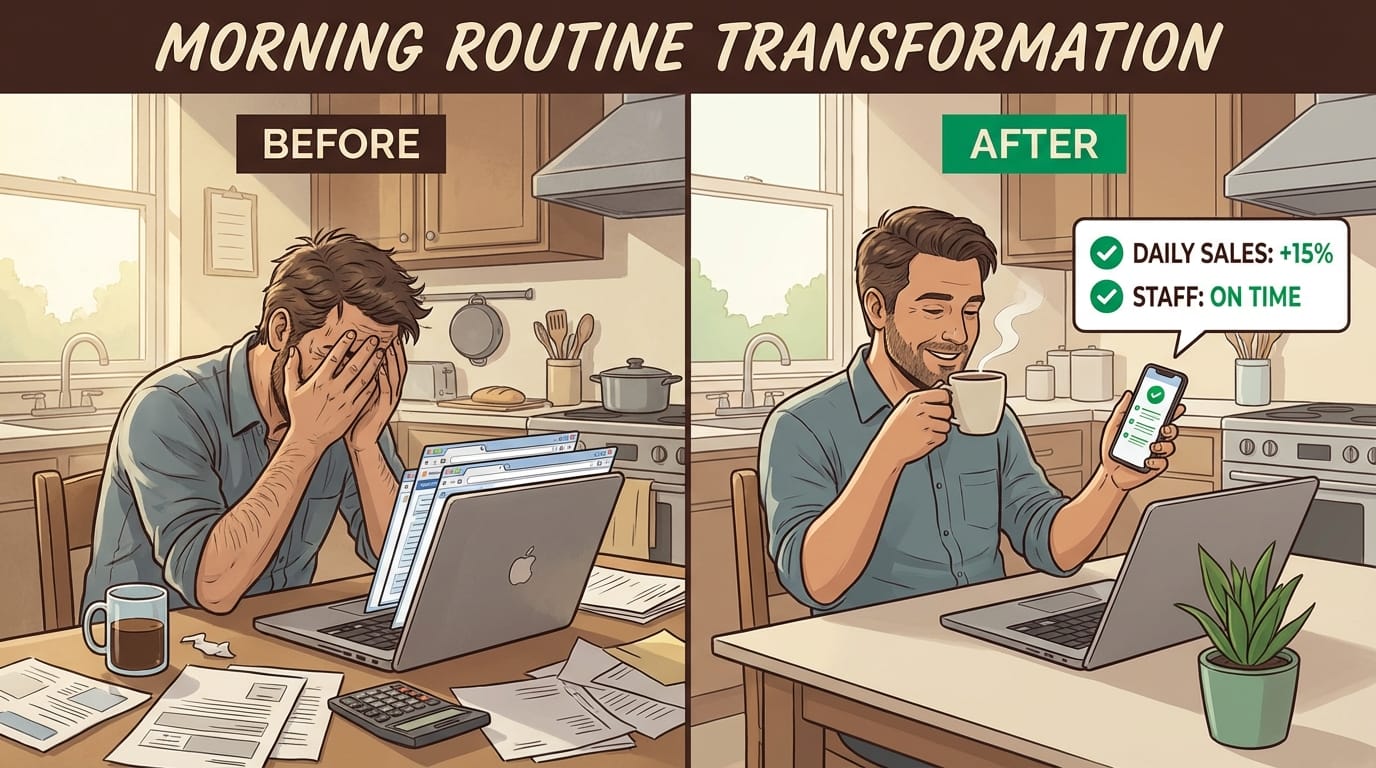
Every morning, the owner of a growing pizza chain was doing the same thing: logging into three different systems, copying numbers into a spreadsheet, and hoping nothing got mixed up. By the time the daily report was ready, 30 to 60 minutes had vanished. And that was on a good day.
This is a restaurant automation case study about fixing exactly that problem—not with expensive enterprise software, but with a simple n8n workflow that now runs automatically before the first employee clocks in.
The Problem: Three Stores, Three Systems, Zero Integration
This pizza chain operates three locations across the same metro area. Each store uses the same point-of-sale system, the same restaurant management platform, and feeds data into the same Google Sheets workbook for owner reporting.
In theory, everything should talk to each other. In practice, nothing did.
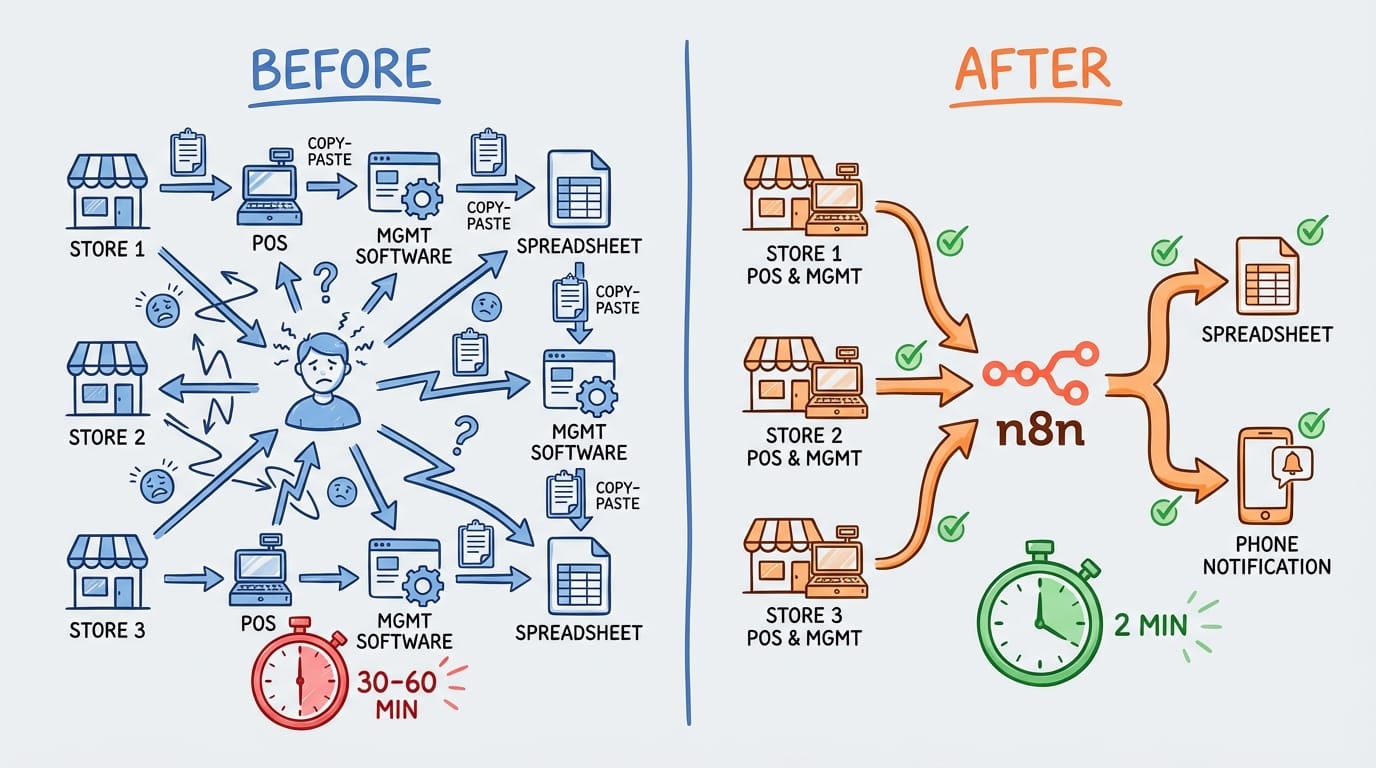
The daily routine looked like this:
- Log into the POS dashboard for each location
- Export yesterday's sales, voids, and discounts
- Log into the management platform for labor hours and food cost estimates
- Manually enter everything into a master spreadsheet
- Cross-check numbers to catch copy-paste errors
- Flag anything unusual for follow-up
On a smooth day, this took 30 minutes. When something didn't match up—a voided transaction that didn't sync, a missing time punch—it could stretch past an hour.
The owner knew this wasn't sustainable. With plans to open a fourth location, the reporting workload would only grow. And the real cost wasn't just time—it was mental energy spent on data entry instead of actually running the business.
The Solution: n8n Workflow Connecting Everything Automatically
We built an n8n automation workflow that does the entire reporting process without human intervention. Here's how it works:
6:00 AM daily trigger — The workflow kicks off automatically, before anyone arrives at the stores.
POS data pull — n8n connects to the point-of-sale API and retrieves yesterday's sales data for all three locations. This includes gross sales, net sales, voids, discounts, and payment method breakdowns.
Management platform sync — The workflow then pulls labor data and preliminary food cost percentages from the restaurant management system.
Data transformation — n8n normalizes the data formats (different systems use different date formats, decimal handling, etc.) and calculates key metrics: sales per labor hour, void percentage, discount percentage.
Google Sheets update — Everything gets written to the master spreadsheet in the exact format the owner was already using. No learning curve, no new dashboards to check.
Slack notification — A summary message hits the owner's phone by 6:15 AM with the key numbers and any flags (void percentage above threshold, labor cost spike, etc.).
The entire workflow runs in under 2 minutes. The owner wakes up to a complete report instead of a to-do list.
Why This Pattern Works for Any Multi-Location Business
This isn't unique to pizza chains. We've seen the same problem in retail stores, dental practices, fitness studios—anywhere you have multiple locations with data living in separate systems.
The pattern is always the same:
- Multiple data sources that don't natively integrate
- Daily or weekly reporting that requires manual aggregation
- Spreadsheets as the glue holding everything together
- Owner or manager time spent on data entry instead of decisions
n8n is particularly good for this because it handles API connections, data transformation, and scheduling in one place. No code required for most workflows, though we added some custom logic for the anomaly detection.
The total build time for this project was about two weeks, including testing across all three locations and building in error handling for edge cases (API timeouts, missing data, etc.).
The Results: Time Back, Plus Unexpected Benefits
30-60 minutes saved daily — This was the primary goal, and it's been consistent since launch. Over a month, that's 15-30 hours of owner time recovered.
Faster anomaly detection — The automated flags catch issues the owner used to miss during manual entry. A spike in voids at one location got flagged within 24 hours instead of being noticed at month-end.
Confidence in the numbers — No more wondering if a copy-paste error is throwing off the totals. The data flows directly from source systems.
Scalability — Adding the fourth location to the workflow will take about an hour of configuration. The manual process would have added another 10-15 minutes per day.
The owner's summary: "I used to start every day frustrated. Now I start it informed."
At Etere Studio, we've built similar automations for businesses across industries. The specifics change—different systems, different metrics—but the approach is the same: identify the repetitive data work, connect the systems, and give people their time back.
Dealing with your own version of this problem? We're happy to take a look. Get in touch