
Scaling Flutter Apps for High Traffic: Architecture, Performance, and Real-World Costs
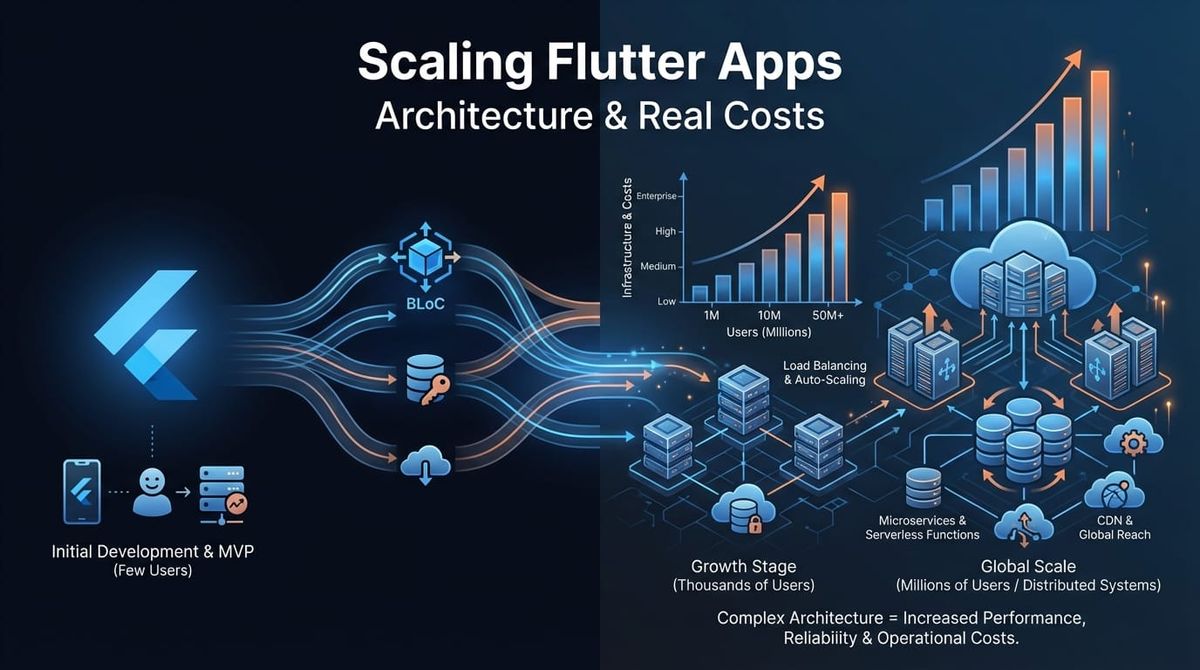
Most Flutter apps don't have scaling problems until they do. You're at 50k users, everything works fine. Then you hit 200k and suddenly requests timeout, the app feels sluggish, and your server costs triple. We've seen this pattern enough times to know: scaling isn't about throwing more servers at the problem. It's about architecture decisions you make early.
Here's what actually matters when scaling a Flutter app from thousands to millions of users. We'll skip the theory and focus on patterns we've implemented in production.
Architecture Patterns That Actually Scale
Flutter's flexibility is both an asset and a trap. You can structure state management dozens of ways, but only a few patterns hold up under real load.
BLoC (Business Logic Component) separates business logic from UI completely. At Etere Studio, we use BLoC for apps where predictable state flow matters more than development speed. The pattern shines when you need to trace exactly how data moves through your app, which becomes critical when debugging performance issues at scale.
The key benefit: testable business logic without UI dependencies. When you're optimizing for performance, you can profile and refactor business logic independently. We've seen 40% response time improvements just from optimizing BLoC event handling in high-traffic scenarios.
Riverpod is our default for most projects now. It's more flexible than BLoC for smaller teams and handles dependency injection cleanly. The real advantage at scale: Riverpod's provider system makes it trivial to swap implementations. Need to add caching to an API call? Change one provider definition. Need to A/B test a new data source? Create a provider override.
Riverpod's automatic disposal prevents memory leaks that plague apps under sustained use. We've measured apps maintaining stable memory usage after 8+ hours of continuous operation, which matters for users who never close your app.
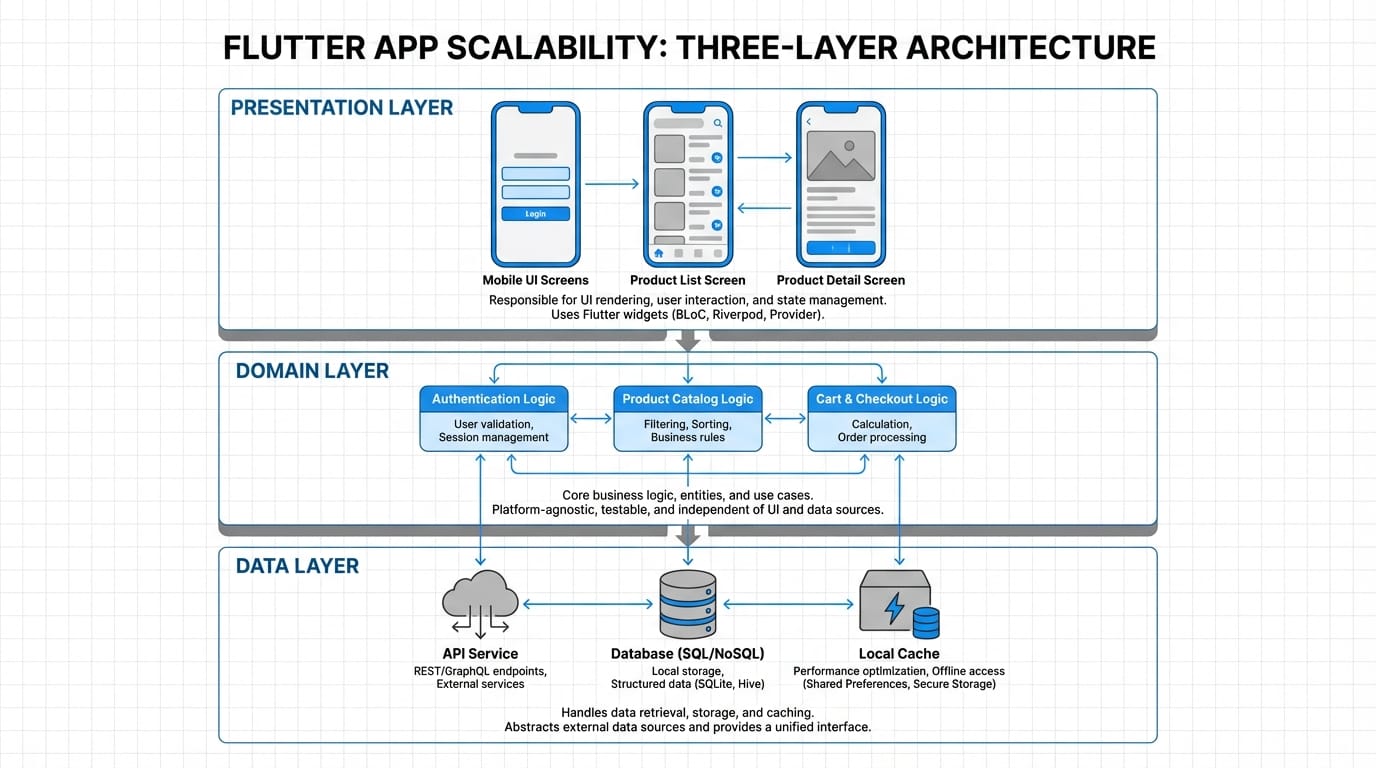
Clean Architecture sounds academic until you need to replace your entire backend. We structure apps in three layers: presentation (Flutter widgets), domain (business logic), and data (API clients, local storage). Each layer only knows about the one below it.
This matters at scale because optimization happens at different layers. UI optimization (reducing rebuilds, lazy loading) happens independently from data layer optimization (caching, request batching). We've refactored backend integrations without touching a single widget.
Practical example from a recent project: migrating from REST to GraphQL in an app with 300k users. Clean architecture meant we only changed the data layer. Testing was isolated. Rollback was simple. Zero user-facing bugs.
Database Optimization and Caching Strategy
Your database is probably your bottleneck. Even if it isn't yet, it will be.
Indexing is the lowest-hanging fruit. Most developers index primary keys and forget about it. But when you're querying user_id on every request and filtering by created_at for pagination, you need composite indexes.
We profile slow queries monthly in production. Anything over 100ms gets an index or a query rewrite. A recent example: user feed query went from 800ms to 45ms by adding a composite index on (user_id, created_at DESC). Cost: literally zero. Impact: massive.
Connection pooling prevents database connections from becoming your limiting factor. Most apps default to creating new connections per request, which doesn't scale. We configure connection pools based on expected concurrent users:
- 1k-10k users: 20-30 connections
- 10k-100k users: 50-100 connections
- 100k-1M users: 200-500 connections (with read replicas)
The math: each connection uses ~10MB RAM. A pool of 100 connections costs 1GB. That's cheap insurance against connection timeout errors.
Query optimization means being brutal about what data you fetch. We've seen apps fetching entire user objects when they only need an ID and name. Over 10k requests per minute, that's gigabytes of unnecessary data transfer.
Pattern we use: GraphQL fragments or specific REST endpoints for each use case. Loading a user list? Fetch id, name, avatar_url. Full profile? Different endpoint. Saves bandwidth and database CPU.
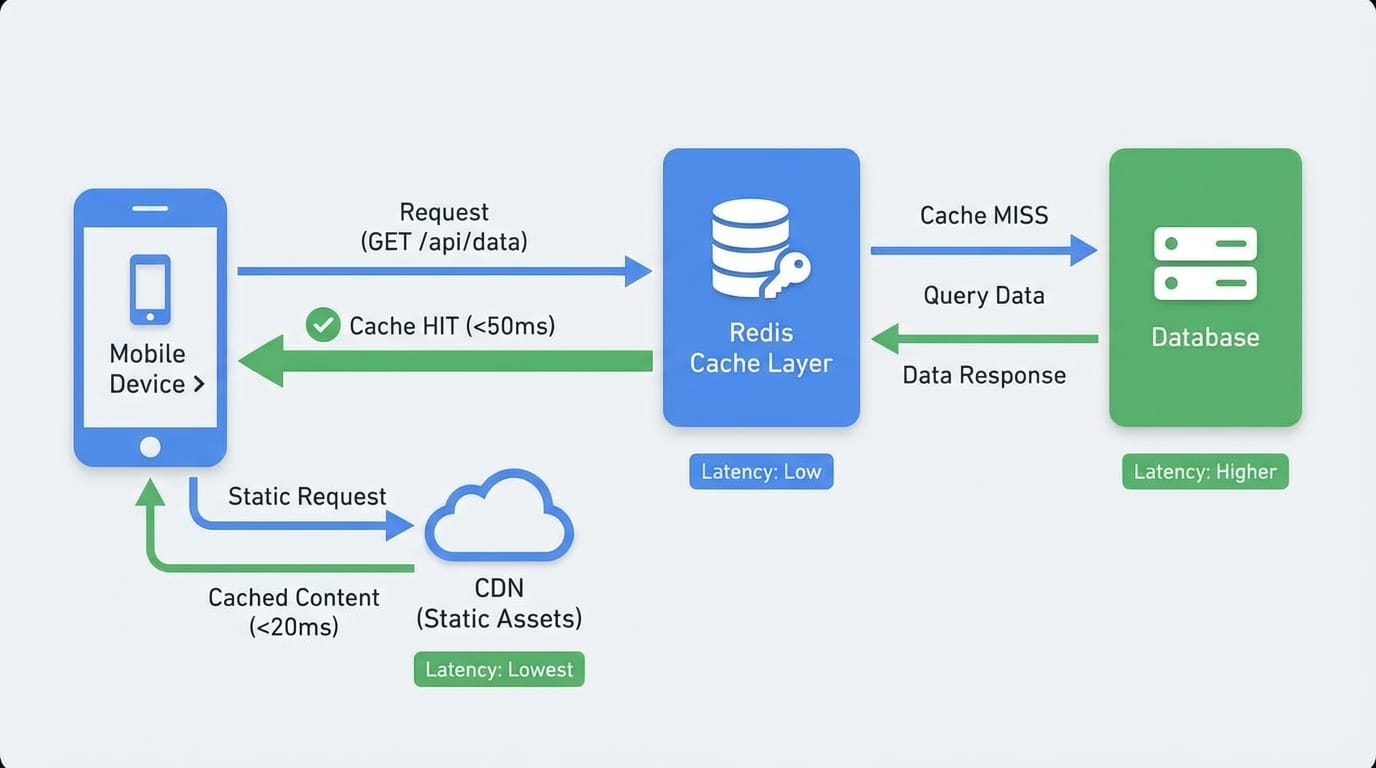
Caching strategies vary by data type:
Redis for session data, user preferences, rate limiting. Anything you need to share across server instances. We cache aggressively: user profiles (5 minute TTL), API responses for public content (15 minutes), computed aggregates like follower counts (30 minutes).
Real numbers from a production app: Redis reduced database queries by 65%. Cache hit rate stays around 85%. Server costs dropped $400/month. Redis costs: $30/month.
In-memory caching on the Flutter side for reference data that rarely changes. Categories, settings, user's own profile. We use packages like flutter_cache_manager for images and custom caching for JSON data.
Pattern: check cache, return if valid, fetch from API if stale, update cache. Sounds simple but reduces perceived latency significantly. Users see data instantly while fresh data loads in background.
CDN for static assets is non-negotiable at scale. Images, videos, fonts, anything static goes to a CDN. We use Cloudflare or AWS CloudFront depending on the project.
The impact: serving a 500KB image from your API server costs ~$0.10 per 1000 requests. Same image from a CDN: ~$0.01. At 1M image loads per day, that's $900/month saved. Plus images load 3-5x faster for users.
Performance Monitoring and Bottleneck Identification
You can't optimize what you don't measure. We instrument everything.
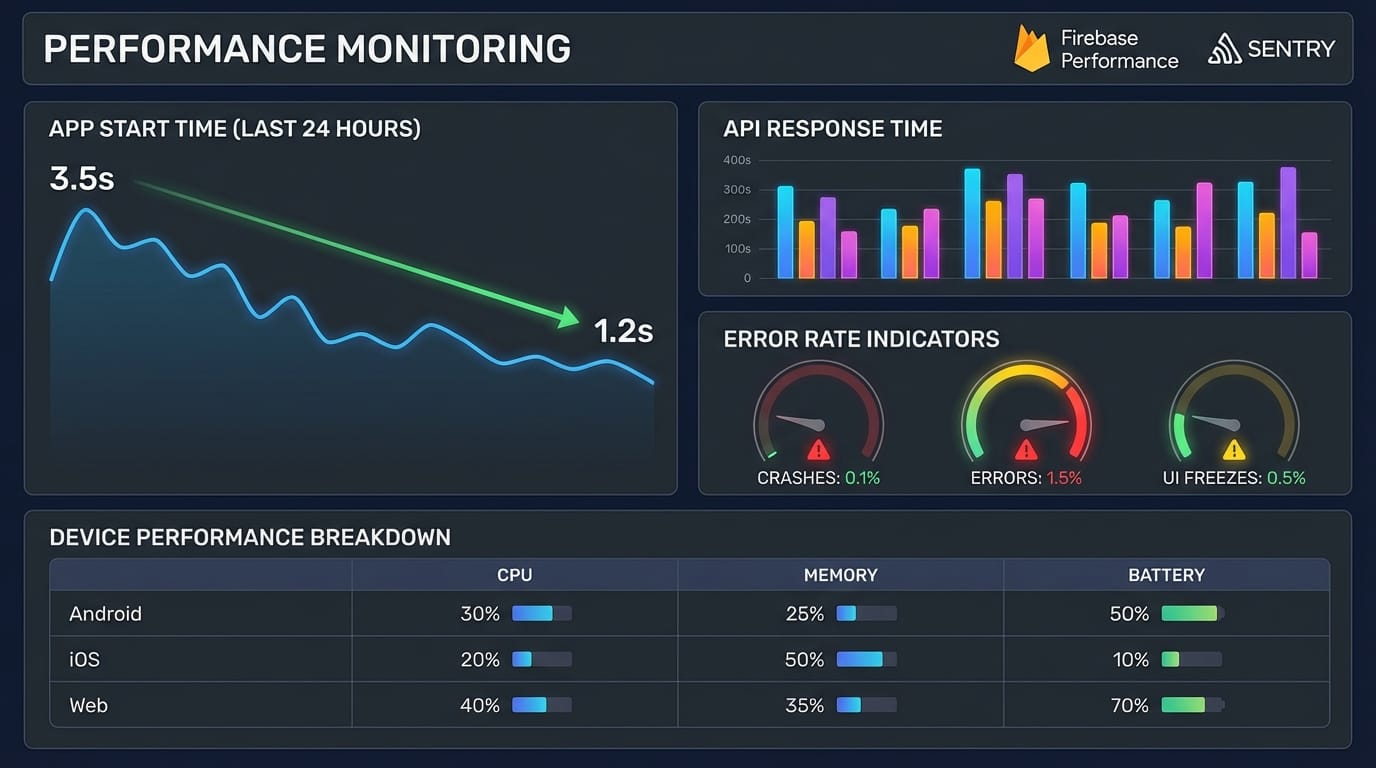
Firebase Performance Monitoring gives you real-world performance data from actual users. We track:
- App start time (cold and warm)
- Screen rendering time
- Network request duration
- Custom traces for critical user flows
The value: you see performance across different devices and network conditions. That flagship Android phone in your office? Your users have 3-year-old budget devices on spotty 4G. Firebase shows the reality.
We set alerts for 95th percentile metrics. If 95% of users see under 2 second app start, we're good. If that creeps to 3 seconds, we investigate.
Sentry for error tracking and performance. We track:
- API error rates by endpoint
- Crash-free user percentage
- Transaction performance (backend response times)
Sentry's real-time alerting caught a database connection leak at 2AM before most users woke up. The leak would have crashed the app for morning traffic. Instead, we fixed it in 20 minutes.
Custom metrics for business-critical flows. We instrument:
- Time to first content (not just app start)
- Successful action completion rates
- Retry rates for failed requests
Example: we noticed users retrying a payment flow 30% of the time. Metrics showed the issue wasn't errors, it was unclear UI feedback. The backend succeeded but the app didn't show confirmation for 2 seconds. Added a loading state, retry rate dropped to 5%.
Bottleneck identification techniques:
- Timeline profiling in DevTools shows frame rendering time. We profile animations and scrolling. Anything dropping frames gets refactored. Usually the culprit is rebuilding too much UI or expensive computations in build methods.
- Network profiling shows payload sizes and request counts. We've found apps making 15 API calls to load one screen. Batching reduced it to 2 calls. Load time went from 4 seconds to 1.2 seconds.
- Memory profiling catches leaks early. We profile during long sessions (30+ minutes of interaction). Memory should stabilize, not climb. If it climbs, we hunt for unsubscribed streams or cached data that never expires.
Load Balancing and Infrastructure
Load balancing becomes necessary around 10k concurrent users. Before that, vertical scaling (bigger server) is simpler.
We use application load balancers (ALB) on AWS or similar on GCP. The pattern:
- Load balancer receives requests
- Routes to healthy backend instances
- Sticky sessions if needed (usually not for mobile APIs)
- Health checks every 30 seconds
Configuration that works: start with 2 backend instances, autoscale up to 10 based on CPU (target 70%). This handles traffic spikes without overprovisioning.
Horizontal scaling means your backend must be stateless. Session data goes in Redis, file uploads go to S3, database is separate. Any backend instance can handle any request.
We've scaled apps from 2 instances to 50 during viral moments. Autoscaling kicked in automatically. Users noticed zero degradation.
CDN implementation for static assets:
- Upload assets to S3 or equivalent
- Point CloudFront (or Cloudflare) at the bucket
- Update Flutter app to load from CDN URLs
- Set long cache TTLs (1 year for versioned assets)
For dynamic content that changes frequently, we use shorter TTLs (5-15 minutes) with cache invalidation on updates. User uploads a profile photo, we invalidate that specific CDN path.
Real Numbers: Server Costs and Performance Benchmarks
Here's what scaling actually costs. These numbers are from production apps we've run.
10k daily active users (DAU):
- Backend: 2x t3.small instances ($30/month)
- Database: db.t3.small ($25/month)
- Redis: cache.t3.micro ($15/month)
- CDN: ~$10/month (500GB transfer)
- Total: ~$80/month
Response times: p50 = 120ms, p95 = 380ms
Database queries: ~50k per day
50k DAU:
- Backend: 4x t3.medium instances ($135/month)
- Database: db.t3.medium ($60/month)
- Redis: cache.t3.small ($45/month)
- CDN: ~$40/month (2TB transfer)
- Total: ~$280/month
Response times: p50 = 150ms, p95 = 420ms
Database queries: ~300k per day
500k DAU:
- Backend: 12x t3.large instances ($1,500/month)
- Database: db.r5.xlarge ($350/month) + 2 read replicas ($700/month)
- Redis: cache.m5.large ($180/month)
- CDN: ~$200/month (12TB transfer)
- Total: ~$2,930/month
Response times: p50 = 180ms, p95 = 520ms
Database queries: ~4M per day, 70% served from cache
Scaling thresholds we watch:
- CPU consistently over 70% → add instances
- Database connections above 80% → add read replicas
- API response time p95 over 500ms → profile and optimize
- Cache hit rate under 75% → review caching strategy
The pattern: costs don't scale linearly. Going from 10k to 50k DAU costs 3.5x more, but 50k to 500k only costs 10x more because infrastructure efficiency improves.
What Actually Matters
Scaling Flutter apps is less about Flutter and more about backend architecture and caching. The Flutter side stays relatively stable because mobile apps are inherently distributed. Your backend is the bottleneck.
Prioritize: proper architecture early (saves months of refactoring), aggressive caching (saves money immediately), monitoring everything (catches problems before users do).
Start simple. Scale when metrics tell you to, not when you think you should.
Dealing with scaling challenges in your Flutter app? We've optimized apps handling millions of requests. Let's talk about your specific situation.